OPEN ACCESS
Prices for Patented Medicines in Canada and 13 Other Countries: Testing the PMPRB’s Narrative Justification for Amending the Regulations
Brett Skinner, PhD, CEO Canadian Health Policy Institute, Editor Canadian Health Policy Journal
ABSTRACT
The prices of patented medicines sold in Canada are regulated by a quasi-judicial agency of the federal government known as the Patented Medicine Prices Review Board (PMPRB). In August 2019 Health Canada introduced changes to the guidelines the PMPRB uses to set ceiling prices for new medicines. The new regulations come into force on January 1, 2022. Health Canada estimated that under the new rules maximum prices allowed for some patented medicines could fall by 52%. Independent studies estimate price cuts from 61% to 84%. Industry, patient groups and researchers have warned the new price limits could cause pharmaceutical companies to deprioritize the Canadian market when launching new medicines, delaying access for Canadian patients; and could also discourage industry investment in pharmaceutical R&D in Canada. Health Canada and the PMPRB dismiss these concerns as lacking evidence. The PMPRB narrative justification for amending the regulations is that Canadian prices are too high, and it cites Canada’s rank in international comparisons as evidence. The agency relies on its own internal analysis to support this claim, but it has not been independently audited. This study tests the validity of the PMPRB’s narrative. Prices for 100 top selling patented medicines in Canada were compared to prices for symmetrical products in the 11 countries specified by the new regulations for international referencing, plus former reference countries Switzerland and the United States. Data were obtained for the calendar years 2018, 2019 and 2020 from the IQVIA® MIDAS® database, which is the same source used by the PMPRB. Bilateral price ratios showed that Canada consistently ranked in the middle of the 14 countries studied, whether prices were measured as averages or as medians, and whether prices were denominated at market exchange rates or purchasing power parities, and when compared to GDP per capita. An objective interpretation of Canada’s rank is that prices for patented medicines are moderate next to the PMPRB’s 13 current and former reference countries. PMPRB’s narrative is not supported by the evidence. The amendments are unwarranted and risky.
SUBMITTED: August 2, 2021 | PUBLISHED: August 31, 2021
DISCLOSURES: The author is the Chair of CHPI’s Access to Innovative Medicines research program which is partly funded by sales of corporate group subscriptions to employees of pharmaceutical companies. Open Access was sponsored by the program.
DISCLAIMER: This research was conducted with data obtained under license from IQVIA, Canada Inc. and sourced from the IQVIA® MIDAS® proprietary database, calendar years 2018, 2019 and 2020. The statements, findings, conclusions, views, and opinions expressed herein are not necessarily those of IQVIA Canada Inc. or any of its affiliated or subsidiary entities. The prices presented in this study are reported at the gross ex-factory manufacturer list price level and therefore do not reflect actual prices paid net of rebates.
CITATION: Skinner, Brett (2021). Prices for Patented Medicines in Canada and 13 Other Countries: Testing the PMPRB’s Narrative Justification for Amending the Regulations. Canadian Health Policy, August 2021. ISSN 2562-9492 www.canadianhealthpolicy.com
[download PDF to access exhibits]
POLICY ISSUE
Since 1987, the prices of patented medicines sold in Canada have been regulated by a quasi-judicial agency of the federal government known as the Patented Medicine Prices Review Board (PMPRB). In August 2019 the PMPRB introduced changes to the regulatory guidelines it uses to set ceiling prices for new medicines. The new regulations were to come into effect on July 1, 2020, but the government delayed implementation until January 1, 2021, due to the COVID-19 pandemic. In December 2020, the government announced a second delay extending to July 1, 2021. Most recently, in June 2021, the government announced a third delay until January 1, 2022.
The PMPRB has argued that the amendments are needed to fulfill its mandate which is to prevent “excessive” prices for patented medicines.[1] The new regulations use several tests to determine whether the price of a patented medicine is excessive. Under both the old and new regulations, the Canadian price is deemed to be excessive if it exceeds the median international price (MIP) for the same drug sold in a specified group of reference countries. The new regulations change the mix and the number of reference countries used for price comparison. New economic factors are also being introduced including prescriptive formulae for calculating the pharmacoeconomic value of new medicines. Patented drugs priced higher than their computed pharmacoeconomic value are subject to dramatic price cuts. The regulations also impose profit controls on drug products with sales revenue exceeding defined thresholds, with further adjustments for market size and the gross domestic product (GDP) per capita in Canada.
The changes are intended to dramatically cut the maximum prices allowed for patented medicines by the regulations. Health Canada’s cost-benefit analysis estimated that the combined changes could reduce prices for high-cost drugs by 52% from the current maximum.[2] Independent studies have demonstrated that the new regulated price ceilings could be from 61% to 84% lower.[3] [4] Industry, patient groups and researchers have warned that the new price limits could cause pharmaceutical companies to deprioritize the Canadian market when launching new medicines, delaying access for Canadian patients; and could also discourage industry investment in pharmaceutical research and development (R&D) in Canada. The PMPRB has rejected these concerns as lacking evidence, stating that “prices do not appear to be an important determinant of medicine launch sequencing” and “The link between high domestic prices and industry investment has not been demonstrated.”[5]
POLICY PROBLEM
The PMPRB’s narrative justification for amending the regulations is that Canadian prices are too high relative to other countries as evidenced by Canada’s rank in international price comparisons. [6] [7] The agency relies on its own internal analysis of international drug prices to support this claim. Despite the potential negative impacts from the implementation of the regulations, the Board’s analyses have not been independently audited.
PMPRB Analyses
The PMPRB 2019 annual report (most recent year) includes bilateral price comparisons with each of the seven countries currently specified by the regulations for international price referencing to Canada. Known as the PMPRB 7, these include France, Germany, Italy, Sweden, Switzerland, the United Kingdom, and the United States. Under the new regulations this group expands to the PMPRB 11 by removing the United States and Switzerland and adding Australia, Belgium, Japan, Spain, Netherlands, and Norway. The data source used for these international price comparisons is the publicly available gross ex-factory manufacturer list prices that patentees are required by regulation to report to the PMPRB. The 2019 Canadian data sample represented the universe of patented medicines reported to the regulator and was comprised of 1,331 drug products of various dosage strengths and forms accounting for CAN $17.2 billion in gross sales at manufacturer list prices. PMPRB also reports the number of foreign drug products matching the Canadian products for each comparator country. The Canadian products paired in the bilateral average price ratios reported for the PMPRB 7 represented at least 66% of total Canadian sales in 2019.[8]
The Board’s annual report also includes a separate bilateral comparison of prices across 31 Organisation for Economic Cooperation and Development (OECD) countries. The analysis uses a different data source, specifically the IQVIA® MIDAS® database which contains Canadian and international list prices at the ex-factory manufacturer level, reflecting sales to the pharmacy and hospital sectors. For its OECD analysis the PMPRB does not report the number of foreign pairings with the Canadian products. Nor does it report total sales, or the percentage of sales represented by the bilateral foreign-to-Canadian matches.
Using data reported by patentees for 2019, Canada ranked in the middle (fourth) among the PMPRB 7 reference countries behind higher-priced countries United States, Switzerland, and Germany. Using IQVIA data, Canada ranked fourth highest of the 31 OECD countries.
PMPRB Limitations
The PMPRB international price rankings (both for the PMPRB 7 and the OECD 31) are derived from data and analyses that are subject to significant limitations. The results are therefore of questionable certainty, accuracy, and significance. The limitations recommend against drawing definitive conclusions from the results or incorporating such data and analyses into formal regulation. A brief description of each limitation is presented below.
Exaggerated Significance of International Rankings
PMPRB has cited Canada’s rank in international price comparisons as a primary rationale for amending the patented medicines regulations. However, international rankings of pharmaceutical prices are not very meaningful because they tend to exaggerate the actual differences between prices. The absolute difference between each rank position is equal to one or 100%. Whereas the difference in prices is often far less than 100%. In fact, international price differences are often small enough to fall within a normal margin for statistical error (+/- 10%). Rankings should therefore be interpreted cautiously.
List Prices vs Actual Prices
The PMPRB analyzes the cost of drugs at the manufacturer’s list price level, which does not reflect actual prices. List prices exclude rebates negotiated between manufacturers and public and private payers. Rebates can vary widely across jurisdictions, and actual prices paid can be substantially lower than the manufacturer’s list price used for international comparisons.
There is no published source of product-level data on final prices because rebates are confidential business information protected by contract and constitutional law. In Canada, rebates have recently been affirmed by the Federal and Quebec courts to be constitutionally protected private information.[9] [10] However, some aggregate data were published by Ontario’s Auditor General indicating that the province’s public drug plan received rebates averaging 36% on brand name drugs in the fiscal year 2016/17.[11]
In the United States, actual prices paid are deeply discounted from list prices. Annual research from the UK examining US drug rebates has shown that the final price paid for patented medicines in the United States can be up to 70% lower than the publicly available list price.[12]
The PMPRB does not compare actual prices, therefore its analysis should be interpreted cautiously.
Price and Income Variability
International comparisons of nominal price differences do not reflect the actual affordability of patented medicines across countries. OECD countries are used for international comparisons because they have roughly similar developed economies and political systems. However, average incomes vary significantly across OECD countries. For example, 2020 gross domestic product (GDP) per capita among the 14 countries examined in this study varied from a low of $38,335 in Spain to a high of $71,298 in Switzerland, measured in US dollars at purchasing power parities (PPP). Research shows that the prices of patented medicines tend to follow variation in average income across countries, other factors held constant.[13] [14] [15] Prices tend to be higher in wealthier countries, but account for a lower percentage of average income. Symmetrical comparisons of drug prices should control for income differences between countries. The PMPRB’s international price rankings do not account for variation in average income. The results do not reflect the actual cost burden experienced across countries due to patented drug prices.
Case Inclusion Criteria
According to the PMPRB “it is not always possible to find a matching foreign price for every strength and dosage form of a patented medicine sold in Canada… it is not uncommon for the US to be the only comparator country with an available price…”[16] Yet the PMPRB calculates average foreign-to-Canadian price ratios for patented medicines across the OECD only “for medicines with prices available in at least three foreign markets.”[17] This implies that potential comparisons were excluded from the PMPRB analysis when prices were available in less than three markets. Exclusion of these cases could skew the results.
Basic Unit of Measure
The PMPRB average foreign-to-Canadian price ratios for the OECD countries are reported at the “medicine level”.[18] It is unclear what this means because the terminology is not used by the IQVIA MIDAS database. Nevertheless, prices should be reported at the standard unit level which is available from the database. IQVIA defines standard units as the number of tablets, millilitres or grams sold, divided by the smallest common dosage. Standard units permit fair comparisons of prices across products with different dosage strengths, pack sizes and sales volumes.
Sales Weights
The average price ratios reported by the PMPRB are “sales-weighted arithmetic means of price ratios obtained for individual DINs, with weights based on Canadian sales patterns.”[19] The method produces a hypothetical price. Foreign prices should be weighted by domestic sales volumes which would reflect the actual prices in their domestic market. Using a price per standard unit permits symmetrical comparisons aggregated at the molecule level that are intrinsically weighted by domestic sales volumes.
Currency Exchange Rates
The average price ratios reported by the PMPRB are calculated using currency exchange rates that are “36-month moving averages of market rates the PMPRB normally uses in applying its Guidelines.”[20] The method is less accurate than simply using the MIDAS transaction-specific market exchange rate which is based on the date the sales occurred.
Domestic Patent Status
It is unclear whether the foreign drug products in the PMPRB’s analysis have the same domestic patent status as the Canadian comparator. A fair comparison of international prices requires equivalent patent protection status in both countries.
Data Limitations
The IQVIA MIDAS database relies on audits of retail pharmacies and hospital purchases and is a sample of actual drug sales, which means the data are subject to some degree of statistical error. The PMPRB analysis of list prices in the OECD countries depends on the accuracy of IQVIA data.
METHOD
The data for the study were purchased from the IQVIA® MIDAS® proprietary database, which is the same data source used by the PMPRB for comparison of international prices across OECD countries. The author consulted with IQVIA staff during June and July 2021 regarding all elements of the data request including the sample specifications and verification of definitions regarding data attributes, measures and statistics that comprise the database. All final data were extracted from the MIDAS database in July 2021. Excel tables containing summary descriptive data and the results of the analysis were reviewed by IQVIA and approved for publication. A draft version of the paper was reviewed by IQVIA with an opportunity for comments. IQVIA’s review was restricted to verifying that the published data and data descriptions accurately reflect the contents of the MIDAS database and comply with contractual disclosure rules. IQVIA’s review should not be interpreted as a verification or endorsement of the methods, results, discussion, or conclusions of the study.
The initial research design for the study intended to replicate the PMPRB’s analysis of patented medicines prices across the OECD. However, obtaining data for all 31 OECD countries was not possible due to the author’s resource constraints. The scope of the research was modified to cover Canada and the PMPRB 11 countries plus Switzerland and the United States, to comprise the ‘PMPRB 14’.
Similarly, the initial research design for the study intended to analyze the entire Canadian market for active patented medicines, but this was not possible due to resource constraints. The data sample for this study was narrowed to the 100 top selling pharmaceutical molecules with active domestic patent protection status during each study year, ranked by Canadian gross sales revenue at manufacturer list prices in 2020, plus the foreign molecules that matched the Canadian top 100 molecule list and were under domestic patent protection, and had gross domestic sales greater than or equal to US $1 million at market exchange rates. The revenue criteria were applied to eliminate unbalanced comparisons with molecules reporting insignificant sales. All molecules in the top 100 Canadian sample showed sales revenues above the threshold, the lowest sales being almost US $9.2 million at MER and manufacturer prices. The MIDAS database also reported negative sales for some foreign product forms and these cases were excluded as anomalies.
Data were obtained for the three calendar years 2018, 2019 and 2020. The data attributes, measures and statistics extracted from the MIDAS database included: country, international product name, molecule list name, dosage strength, pack size, manufacturer, corporate owner, product licensing status, estimated domestic patent protection expiry date, calendar year, domestic number of standard units (SU) sold, gross domestic sales revenue at manufacturer list prices (MNF) denominated in US dollars at transaction-specific market exchange rates (MER) and in local currency (LC) at manufacturer list prices, and a pre-calculated average price per standard unit denominated in US dollars MER.
Domestic prices denominated in purchasing power parities (PPP) were calculated for each molecule by country and by calendar year. Total annual sales denominated in local currency at manufacturer list prices were converted to international dollars using the PPP conversion rates published for each year by the OECD.[21] PPP-adjusted total annual sales were divided by the corresponding total number of standard units sold, producing PPP-adjusted total annual sales per standard unit as a comparable standardized price. Dividing total annual sales by the total number of standard units sold is the same method used by IQVIA to calculate the average price per standard unit denominated in US dollars at MER.
For each of the 14 countries studied, 2018-2020 data for gross domestic product (GDP) per capita were obtained from the OECD. [22] When the data were accessed OECD had not yet reported the 2020 GDP numbers for Japan. Supplemental data were obtained from the International Monetary Fund (IMF).[23]
This study objective was to test the validity of the PMPRB’s narrative justification for amending the patent medicines regulations. It was focused on the patented drugs with the largest aggregate cost impact, and therefore most likely to be cited as justification for regulation. It analyzed prices for the 100 top selling patented medicines in Canada compared to 13 other countries comprised of the PMPRB 11 plus former reference countries Switzerland and the United States. The benchmark sample of the 100 top selling actively patented medicines in Canada in 2020 is estimated to represent close to 50% of the total market for sales of patented medicines in that year.
Bilateral foreign-to-Canadian price comparisons were limited to symmetrical drug molecules with the same domestic patent protection status. The analysis used a standardized unit of measure for calculating foreign-to-Canadian price ratios that is comparable across varied dosage strengths, pack sizes and sales weights: defined as gross sales at manufacturer list prices per standard unit sold. The most accurate currency exchange rates were used to denominate prices: i.e., transaction-specific market exchange rates and purchasing power parities. Average and median foreign-to-Canadian price ratios were calculated across the ratios observed for each bilateral comparison of molecules.
A gap score was calculated to compare the economic affordability of patented medicines prices relative to income, which was defined as the difference between average foreign-to-Canadian ratios for patented medicines prices and foreign-to-Canadian ratios for GDP per capita.
DATA SAMPLE
The base year for defining the benchmark Canadian data sample was 2020. TABLE 1 [Appendix] shows the total domestic sales in each of the 14 countries studied, for molecules with active domestic patent status matching the 100 top selling active patent molecules in Canada 2020, in each of the calendar years from 2018-2020, at manufacturer list prices denominated in US dollars MER and local currency.
In 2020 the Canadian sample list included 100 unique molecules across 333 dosage strengths and product forms, accounting for over CAN $9.6 billion in gross sales at manufacturer prices. At the time of this study the PMPRB had not yet published 2020 data for the total market sales of patented medicines. Therefore, an exact sample percentage could not be calculated, but it is roughly estimated to represent close to 50% of the market. The latest data available were current to 2019. In 2019 the Canadian sample list included 98 unique molecules across 305 dosage strengths and product forms, accounting for over CAN $8.1 billion. The 2019 Canadian sample list represented 47% of the $17.2 billion total market sales of patented medicines in 2019. In 2018 the Canadian sample list included 97 unique molecules across 302 dosage strengths and product forms, accounting for CAN $6.9 billion and representing 41% of the $16.7 billion total market sales of patented medicines in 2018. Data were unavailable for total market sales of patented medicines in the foreign countries. Therefore, foreign sample size percentage could not be calculated.
TABLE 2 shows a count of the foreign molecules matching the Canadian top 100. The percentage of foreign molecules with active domestic patent protection matching the top selling 100 active patent molecules in Canada in 2020 varied between countries from a low of 47% in Netherlands to a high of 89% in the United States.
As expected, the current patent status of the top 100 benchmark drugs differed by country. To keep the bilateral comparisons symmetrical, only drugs with the same domestic patent status were included. Therefore, these data should not be interpreted to represent the availability of the medicines in any of the 14 countries.
FOREIGN-TO-CANADIAN PRICE RATIOS
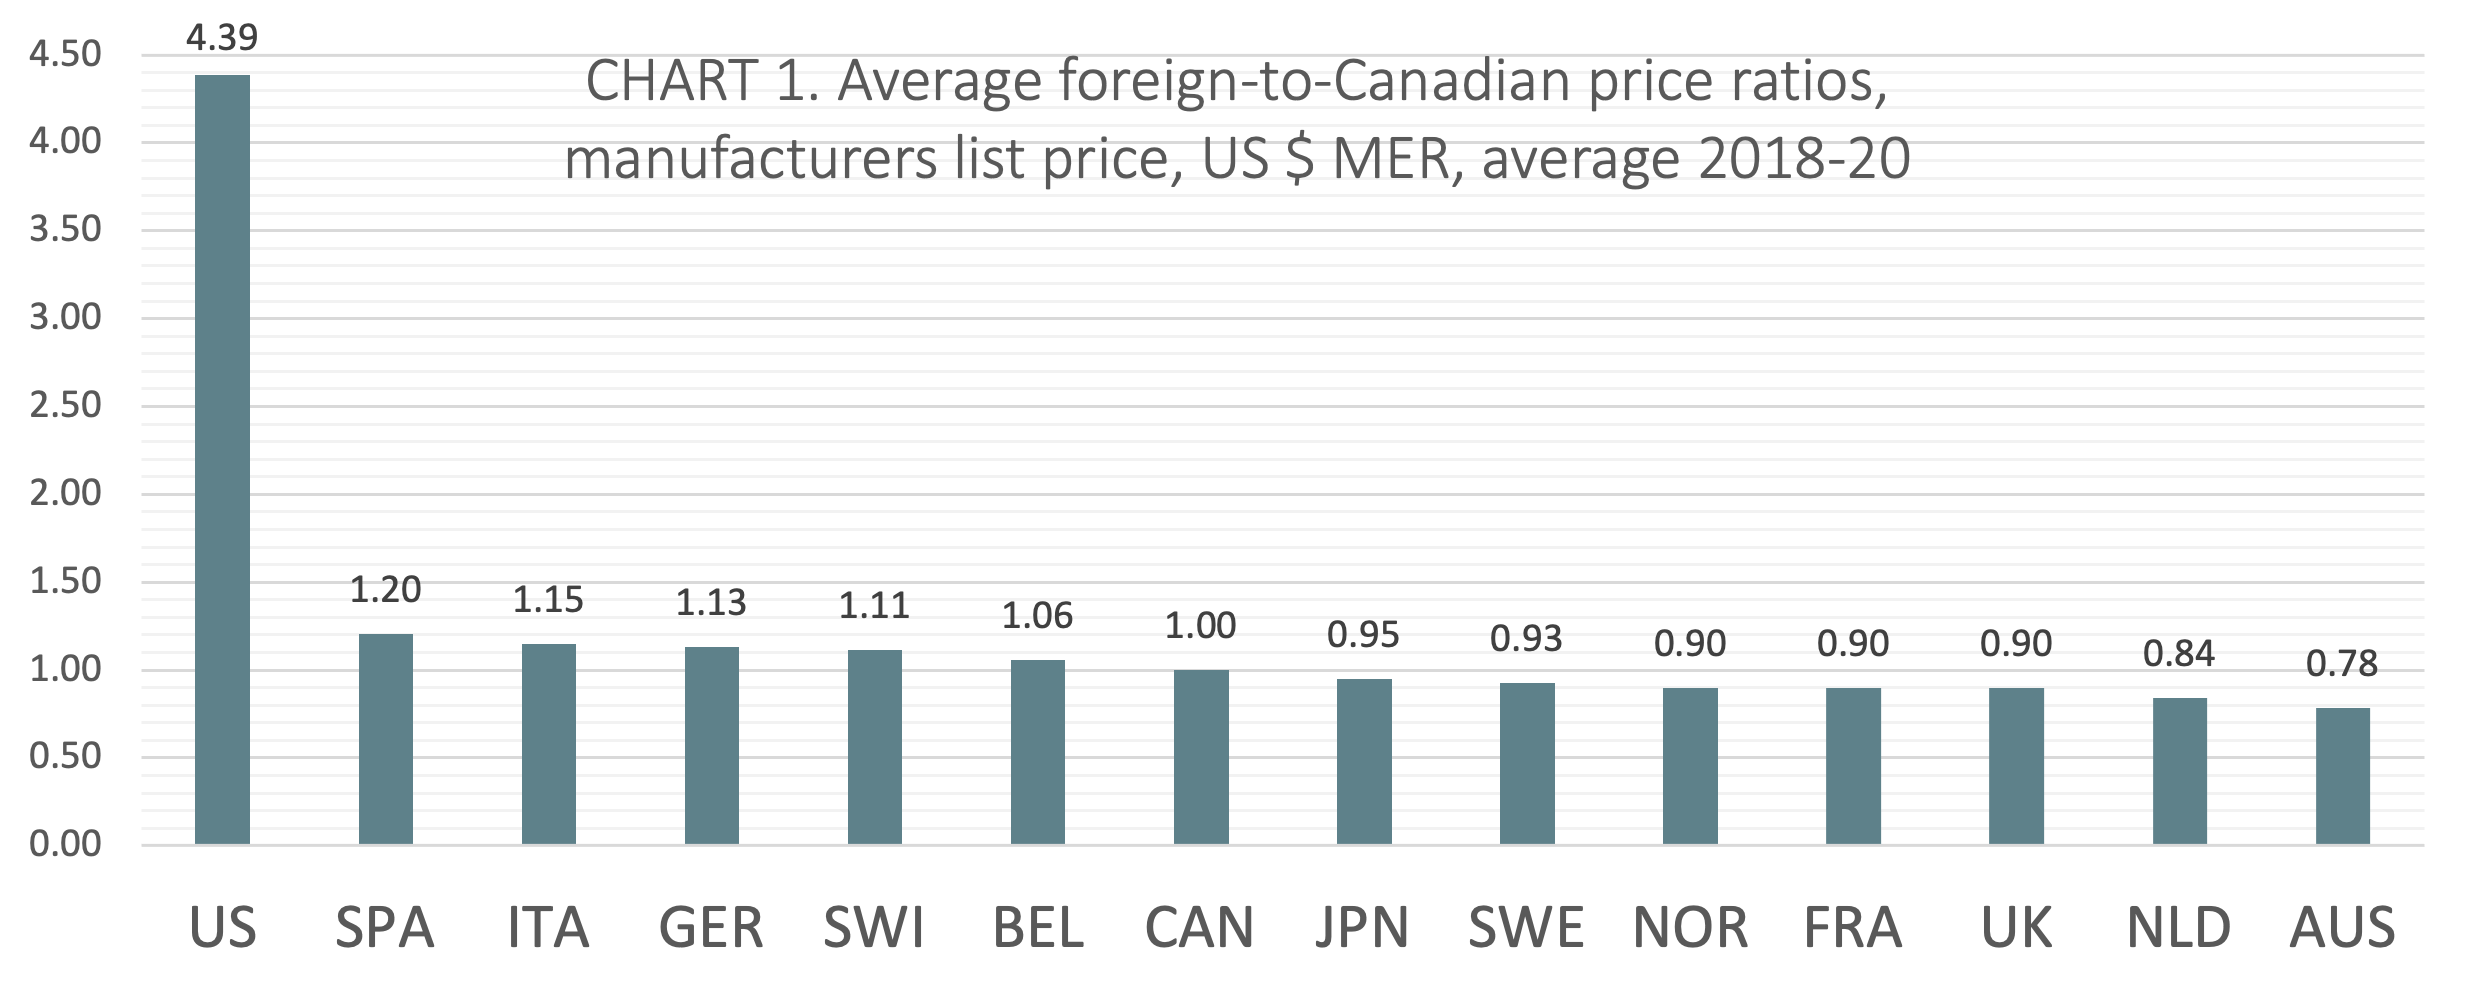
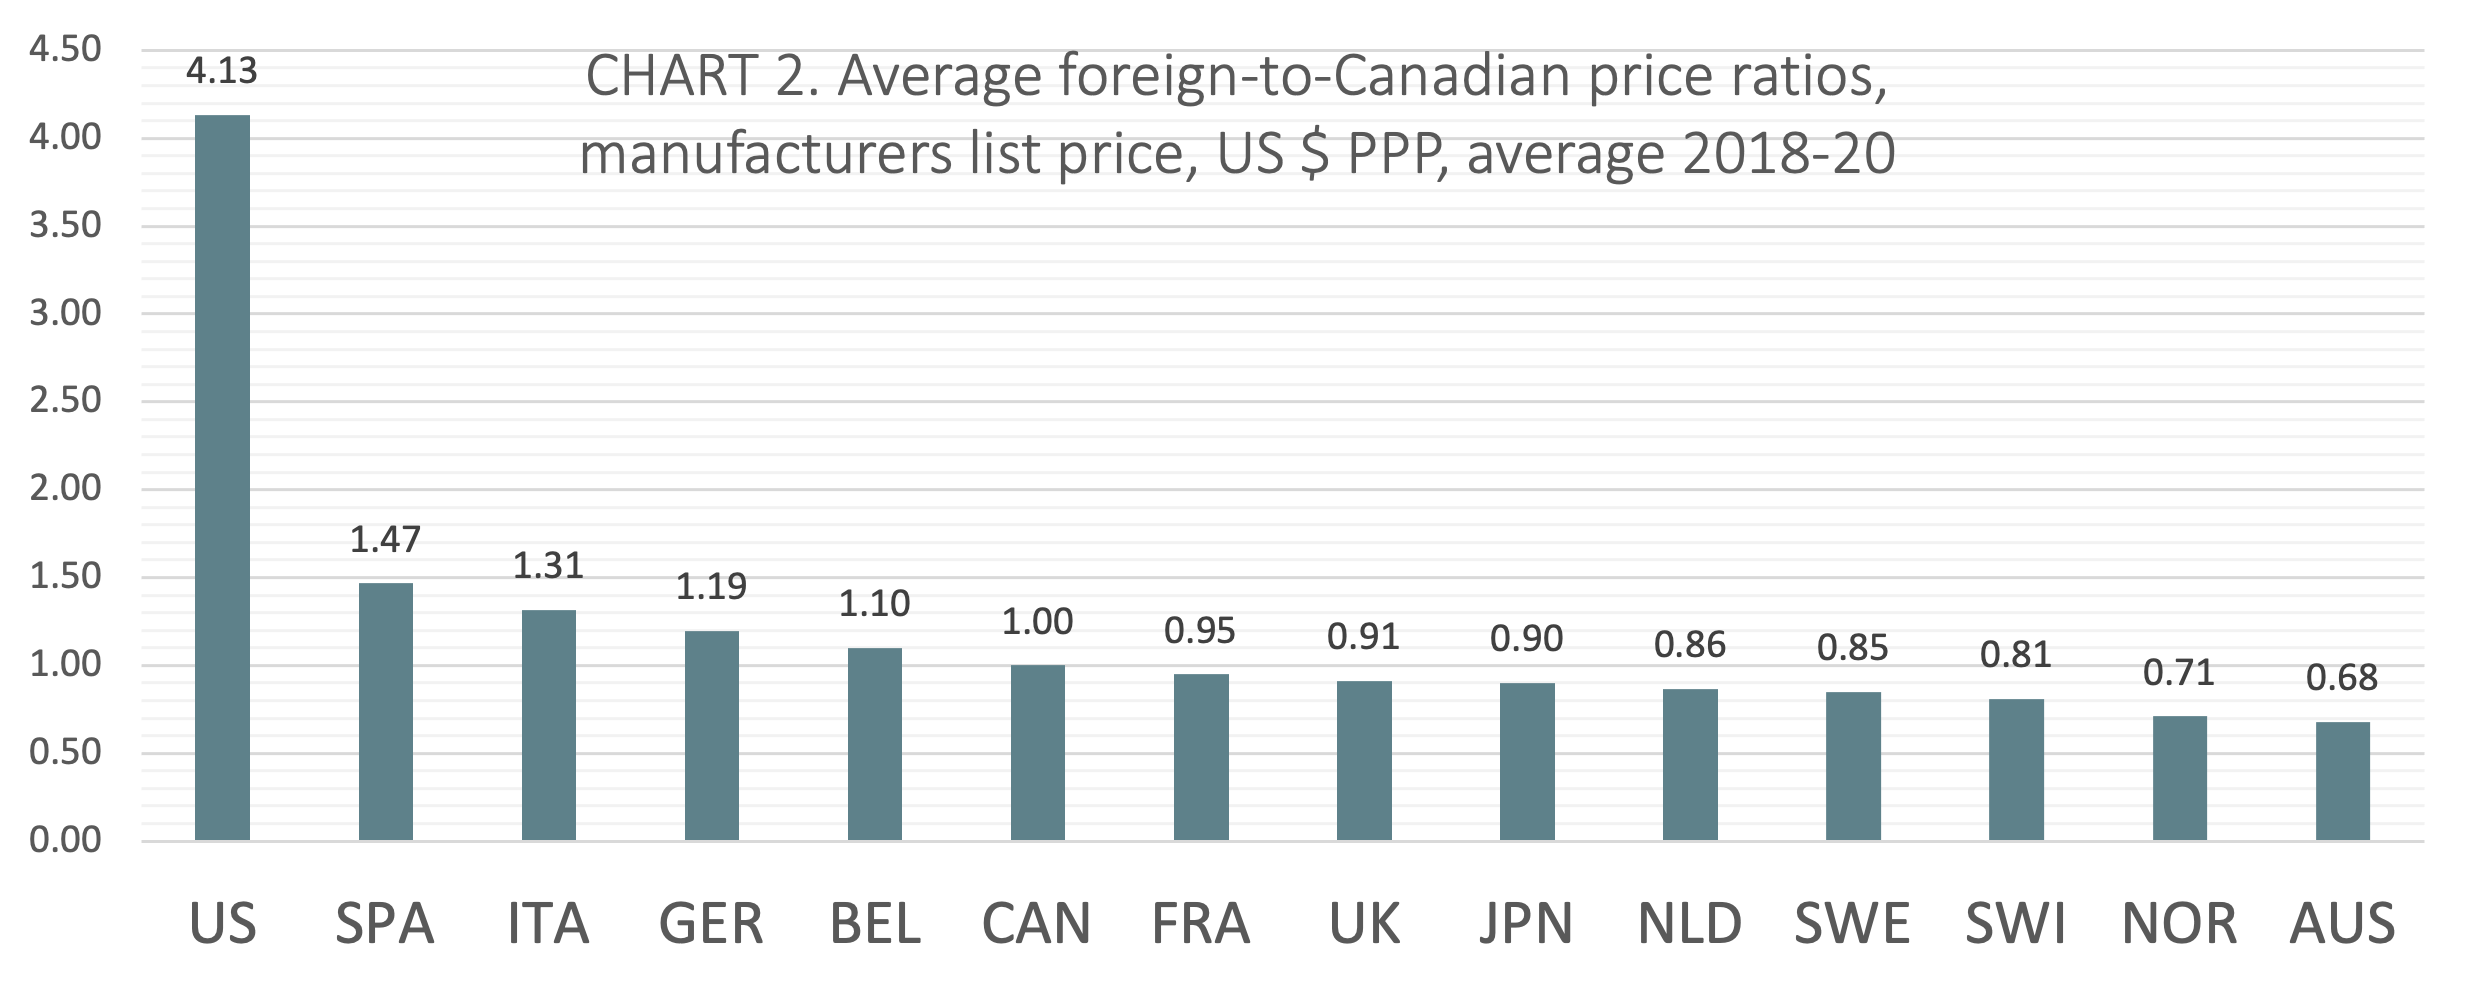
TABLE 3 shows the average and median foreign-to-Canadian price ratios across the 100 top selling active patent drug molecules in Canada for the calendar years 2018 to 2020. Comparisons are measured as sales per standard unit at manufacturer list prices and denominated in both US dollars at MER and PPP. The average and median foreign-to-Canadian price ratios are displayed graphically and in rank order in CHARTS 1-4.
Average US $ MER
(CHART 1) On average over the three calendar years from 2018 to 2020, Canada ranked seventh of 14 countries when average foreign-to-Canadian price ratios were measured at US dollars MER. The six countries ranking higher than Canada include Belgium (avg 1.06:1), Switzerland (avg 1.11:1), Germany (avg 1.13:1), Italy (avg 1.15:1), Spain (avg 1.20:1), and the United States (avg 4.39:1). Notably, five of the 7 countries ranked below Canada had price ratios within 10% of the Canadian benchmark (Japan, Sweden, Norway, France, and the UK).
Average US $ PPP
(CHART 2) On average from 2018 to 2020, Canada ranked sixth of 14 countries when average foreign-to-Canadian price ratios were measured at US dollars PPP. The five countries ranking higher than Canada included Belgium (avg 1.10:1), Germany (avg 1.19:1), Italy (avg 1.31:1), Spain (avg 1.47:1), and the United States (avg 4.13:1). Three countries ranked lower than Canada had price ratios within 10% of the Canadian benchmark (France, the UK, and Japan).
Median US $ MER
(CHART 3 – download PDF) On average from 2018 to 2020, Canada ranked sixth of 14 countries comparing median prices at US dollars MER behind Italy (1.09:1), Germany (1.10:1), Switzerland (1.15:1), Spain (1.17:1), and the United States (3.84:1). Seventh ranked Belgium was within 3%
of the Canadian benchmark.
Median US $ PPP
(CHART 4 – download PDF) From 2018 to 2020, Canada’s rank averaged sixth of 14 countries comparing median prices at US dollars PPP behind Belgium (avg 1.08:1), Germany (avg 1.20:1), Italy (avg 1.27:1), Spain (avg 1.35:1), and the United States (avg 3.57:1).
PRICE RATIOS, GDP RATIOS
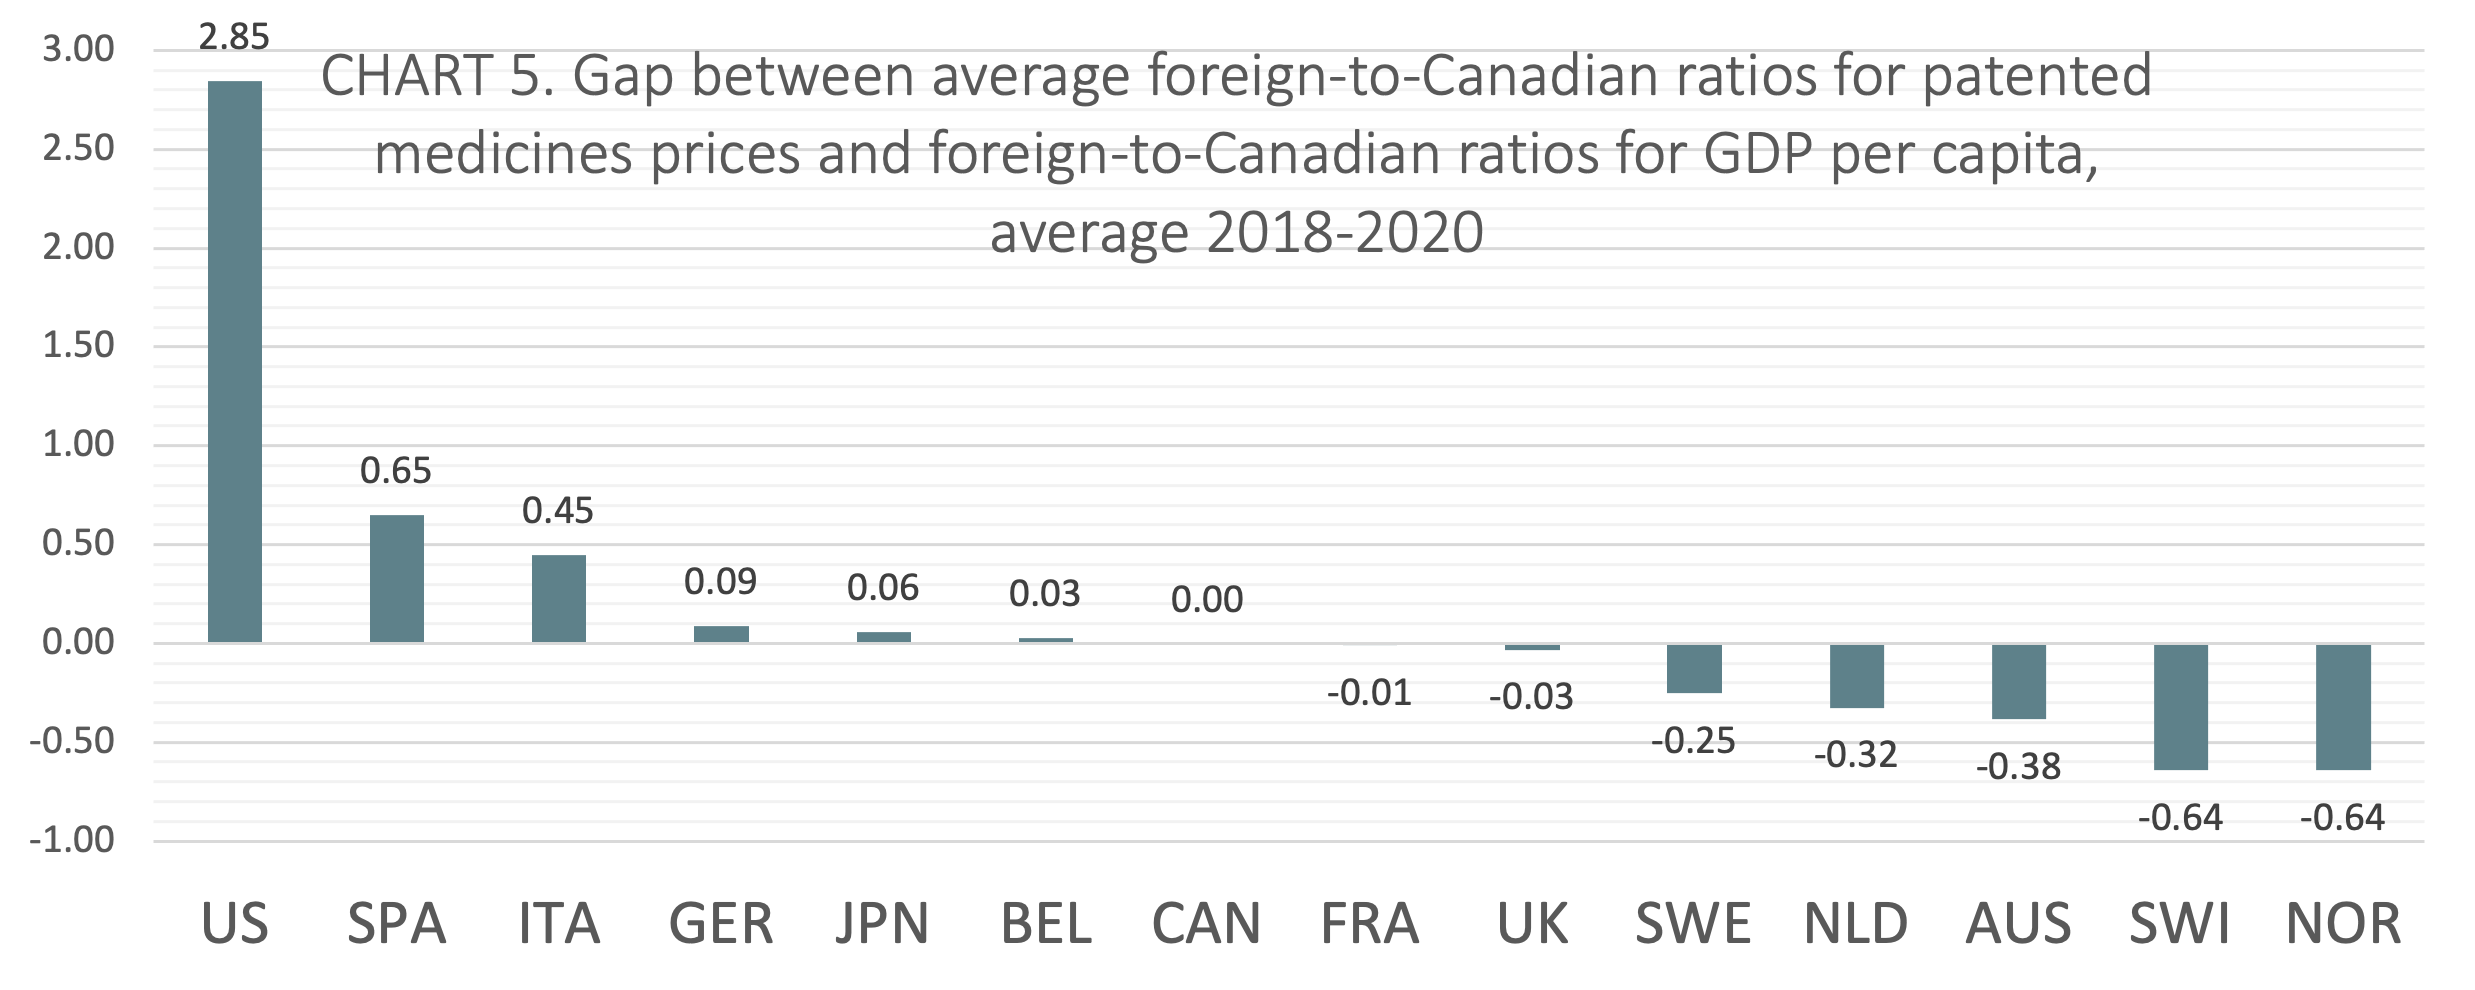
International price comparisons that account for differences in average incomes between countries can be used as a comparative measure of economic affordability for the prices of patented medicines. GDP per capita is a proxy for average income. TABLE 4 shows foreign-to-Canadian ratios for GDP per capita and the average foreign-to-Canadian ratios for patented medicine prices, both stated at US dollars PPP. The table also shows the gap between average foreign-to-Canadian ratios for patented medicines prices and foreign-to-Canadian ratios for GDP per capita, averaged over 2018-2020. The 2018 to 2020 average gap scores are displayed graphically and in rank order in CHART 5.
The gap was calculated by subtracting the foreign-to-Canadian ratio for GDP per capita from the average foreign-to-Canadian ratio for patented medicines prices. Positive values represent average foreign-to-Canadian price ratios that are greater than corresponding foreign-to-Canadian GDP per capita ratios. Negative values represent average foreign-to-Canadian price ratios that are lesser than corresponding foreign-to-Canadian GDP per capita ratios. Relative to domestic incomes, positive values can be interpreted to mean that on average prices are less economically affordable, while negative values can be interpreted to mean that on average prices are more economically affordable.
On average from 2018 to 2020, Canada ranked seventh of the 14 countries studied in the analysis of foreign-to-Canadian ratios for patented medicine prices and GDP. Two of the seven countries that ranked lower than Canada (France, and the UK) had gap scores within 3 percentage points of Canada’s score.
POLICY IMPLICATIONS
PMPRB Rationale Invalid
The main finding of this study is that the PMPRB’s narrative justification for amending the regulations and guidelines is not supported by the available data. Canada ranked in the middle of the 14 countries studied. Canada’s position remained consistent across the three calendar years studied, whether prices were measured as averages or as medians, and whether prices were denominated at market exchange rates or purchasing power parities, and when prices were compared in ratio to GDP per capita. There is nothing about Canada’s rank that would indicate the prices for patented medicines are excessive. The previous regulations and guidelines are adequate to achieve the government’s explicit policy goal and for the PMPRB to fulfil its mandate. The amendments to the regulations and guidelines are not necessary.
PMPRB 11 Selection Bias
The study also shows that the new PMPRB 11 group of reference countries is purposely overrepresented by lower priced markets. The exclusion of higher priced markets and the inclusion of additional lower priced markets artificially causes Canada’s price rank to be higher relative to the remaining countries used for comparison. The biased result might suit the PMPRB’s narrative, but it is not the basis for sound regulation.
One underappreciated aspect of the new regulations is that the exclusion of Switzerland and the United States from the PMPRB reference countries, deprives policymakers of vital information about the effect of price regulations on the availability of new medicines, industry investment in clinical research, and the development of an innovative domestic pharmaceuticals industry in Canada. The United States has the highest drug prices in the world, but Americans enjoy the earliest access to new medicines and the country attracts the highest levels of industry investment in research and development of innovative pharmaceuticals. It serves the public interest for policymakers to be informed of this reality and the trade-offs associated with alternative policy approaches.
PMPRB Suppressed Contrary Evidence
The price changes resulting from the amended regulations could have profound impacts on patient access and industry spending on pharmaceutical R&D. Health Canada and the PMPRB reject such concerns citing a lack of evidence. Yet, they have not referenced research to support their contention that there is no link between price and the availability of new drugs, or between price and industry investment in clinical research.
At the same time, Health Canada and the PMPRB have failed to keep Parliament informed of research indicating that the new price limits could cause pharmaceutical companies to deprioritize the Canadian market when launching new medicines and discourage industry investment in clinical trials research in Canada. Health Canada and the PMPRB are aware of this research because it was cited by several independent submissions to the public consultations held prior to the implementation of the regulations and guidelines.
Price and New Drug Launches
The Ministry and the Board have ignored a widely cited study by Danzon et al (2004), University of Pennsylvania, which analyzed the effect of price on the launch of new drugs in 25 countries finding that manufacturers delay or forego launching in markets where prices are visible to external price referencing and regulation reduces prices below levels expected from local market characteristics.[24]
Kanavos et al (2019) published a study in the European Journal of Health Economics which also showed that manufacturers adopt launch sequencing strategies to mitigate downward price spiral, delaying the launch of new products in low-price countries or in countries with highly regulated prices. Within the EU, this has led to reduced availability of medicines in countries with small markets and lower prices.[25]
Research by the author of the present study (Skinner 2018) examined 31 OECD countries using data from the PMPRB to test the statistical relationship between the number of new drug launches and the market price level for patented drugs, GDP per capita and the total market size (population) in each country. Regression analysis revealed that market price level was the only one of the three independent variables that was a statistically significant predictor of the number of new drug launches. Lower priced markets experienced fewer new drug launches.[26]
In a similar analysis, Spicer and Grootendorst (2020) examined drug launches and patented drug list prices for various OECD countries to inform the impact of the PMPRB regulatory changes on drug launch delays in Canada. Regression analysis found that patented drug list prices exert an economically important effect on launch decisions, holding other factors constant. The researchers further estimated that a 25% price decrease in prices would lead to a 6-10% decrease in drugs launched, and a 45% price decrease will lead to a 13-22% decrease in drugs launched.[27]
Another recent study by Rawson (2020) investigated whether the pending introduction of the new regulations and guidelines was associated with early signs of changes in the number of new drugs being launched in Canada. The study found that the percentage of new drugs approved in Canada decreased substantially in the years following the initiation of the legislative process for the new regulations. The results suggest that the pharmaceutical industry has started to deprioritize drug launches in Canada.[28]
Price and Industry Investment in Clinical Trials
Health Canada and the PMPRB are aware of published research showing a statistical link between price and industry investment in clinical trials. Yet neither organization has referenced this empirical evidence in official communications with Parliament.
Skinner (2019) examined 31 OECD countries for statistical correlations between the geographic distribution of industry-funded clinical trials and variation in drug price levels, controlling for differences in GDP and market size. Regression analysis showed that price-level was a statistically significant predictor of the number of industry-funded clinical trials. The results show that a 1-unit variation (+/-1.00) in the average foreign-to-Canadian price ratio for patented medicines was associated with a variation of +/-613.355 industry-funded clinical trials. The results suggest that a lower price ceiling resulting from the PMPRB regulatory changes will likely cause a substantial decline in the number of industry-funded clinical trials in Canada.[29]
In a series of papers, Rawson (2020-2021) investigated whether there were early warning signs of a decline in clinical trials activity in Canada associated with the publishing of the new price control guidelines in November 2019. The study observed the number of new clinical trials registered before and after the 2019 date. Results showed a significant decrease in trials in Canada following the announcement of the regulatory changes.[30] [31] [32] The PMPRB’s only response to these empirical studies was communicated via Twitter.
There is in fact, a large body of published research that contradicts the PMPRB narrative. Labrie (2020) conducted a systematic literature review that found 44 peer-reviewed studies showing a significant negative relationship between drug price controls and either the availability of innovative drugs or industry investment in pharmaceutical R&D.[33]
Price and Sustainability
Similarly, the PMPRB has not offered any evidence for its assertion that the prices of patented medicines in Canada are threatening the sustainability of the healthcare system. The Ministry and the Board are aware of published analyses showing that patented medicines account for a stable, small percentage of total health spending and GDP.
One example is an annual analysis (which the author of the present study contributes to) published by the Canadian Health Policy Institute that examined PMPRB data for total expenditure on high-cost drugs relative to health spending and GDP. According to PMPRB there were 172 patented medicines defined by the Board as “high-cost” drugs (i.e. drugs with annual treatment costs greater than $10,000 CAD) in 2019, accounting for $8.3 billion in gross sales. It is this group of drugs which the new regulations specifically target because the regulator claims that prices for these drugs are excessive and are causing unsustainable costs for the healthcare system. CHPI researchers calculated that gross sales of high-cost patented drugs represented only 0.4% of GDP and 3.1% of the $265.5 billion national health expenditure in Canada in 2019. Moreover, total gross sales of all patented medicines in 2019 were $17.2 billion accounting for only 0.7% of GDP and 6.5% of national health spending. Patented drugs’ percentage of national health spending was almost the same in 2019 as in 2000 (6.4%): a remarkable 20-year period of near zero average annual relative expenditure growth.[34]
POLICY RECOMMENDATIONS
Repeal Guidelines, Include Former Reference Countries
The Parliament of Canada should repeal the amendments to the patented medicines regulations and revoke the new guidelines. Canadian prices for patented medicines are moderate compared to the PMPRB’s 13 current and former reference countries. The PMPRB’s rationale for the amendments is not supported by the available evidence. The new guidelines are excessive, risky, and unnecessary. Previous guidelines are adequate to achieve the policy goals stated in the Patent Act and the Patented Medicines Regulations. If an expanded group of reference countries is retained in the regulations, then Switzerland and the United States should be included.
Review PMPRB Mandate
The PMPRB has not maintained policy neutrality. It publicly advocates for the amendments. The agency has not presented parliament with a comprehensive, balanced, objective, uncensored summary of all available evidence, for and against the amendments. The agency has suppressed evidence that contradicts its narrative justification for amending the regulations and guidelines, exaggerated the significance of Canada’s international rank and overstated the cost burden of patented drugs on the healthcare system. It has dismissed serious concerns about the impact of the regulations on the availability of medicines and industry investment in clinical research without any reference to evidence. It has thereby failed to properly inform Parliament about the prices of patented medicines. The Parliament of Canada should conduct a formal review of the agency’s relevance. Due consideration should be given to retiring its mandate.
LIMITATIONS
The prices presented in this study are reported at the gross ex-factory manufacturer list price level and therefore do not reflect actual prices paid net of rebates. The analysis depends on the accuracy of IQVIA data. International rankings tend to exaggerate the actual differences between prices and should therefore be interpreted cautiously.
TABLES
|
|||||||||||||||||||||||||||||||||||||||||||||||||||||||||||||||||||||||||||||||||||||||||||||||||||||||||||||||||||||||||||||||||||||||||||||||||||||||||||
|
||||||||||||||||||||||||||||||||||||||||||||||||||||||||||||||||
|
||||||||||||||||||||||||||||||||||||||||||||||||||||||||||||||||||||||||||||||||||||||||||||||||||||||||||||||||||||||||||||||||||||||||||||||||||||||||||||||||||||||||||||||||||||||||||||||||||||||||||||||||||||||||||||||||||||||||||
|
||||||||||||||||||||||||||||||||||||||||||||||||||||||||||||||||||||||||||||||||||||||||||||||||||||||||||||||||||||||||||||||||||||||||||||||||||||||||||||||||||||||||||||||||||||||||||||||||||||||||||||||||||||||||||||||||||||||||||||||||||||||||||||||||||||||||||||||||
REFERENCES
[1] Regulations Amending the Patented Medicines Regulations (Additional Factors and Information Reporting Requirements): SOR/2019-298. Canada Gazette, Part II, Volume 153, Number 17. Registration: SOR/2019-298, August 8, 2019. PATENT ACT: P.C. 2019-1197 August 7, 2019.
[2] Health Canada (2019). Amendments to the Patented Medicines Regulations Cost-Benefit Analysis. Strategic Policy Branch. May 6 2019.
[3] Rawson, Nigel SB; Lawrence, Donna (2020). New Patented Medicine Regulations in Canada: Updated Case Study of a Manufacturer’s Decision-Making about a Regulatory Submission for a Rare Disorder Treatment. Canadian Health Policy, January 2020. https://www.canadianhealthpolicy.com/products/new-patented-medicine-regulations-in-canada–updated-case-study—en-fr-.html
[4] PDCI (2020). Impact Analysis of The Draft PMPRB Excessive Price Guidelines. https://www.pdci.ca/wp-content/uploads/2020/02/PDCI-PMPRB-Impact-Assessment-February-2020_Final.pdf
[5] Regulations Amending the Patented Medicines Regulations… Page 5992.
[6] Health Canada (2017). Protecting Canadians from Excessive Drug Prices: Consulting on Proposed Amendments to the Patented Medicines Regulations. Page 3.
[7] PMPRB (2016). PMPRB Guidelines Modernization: Discussion Paper. Page 6.
[8] PMPRB (2020). 2019 Annual Report. Patented Medicine Prices Review Board.
[9] Innovative Medicines Canada v. Canada (Attorney General). Federal Court Decisions Database. 2020-06-29. 2020 FC 725. T-1465-19
[10] Merck Canada Inc. et al v Canada (Attorney General), Quebec Superior Court file 500-17-109270-192.
[11] Office of the Auditor General of Ontario. Annual Report 2017. Section 3.09 Ontario Public Drug Programs. Page 491.
[12] Vamil Divan and Barbara Kotei (2017). US Pharmaceuticals 2017 Outlook. UK: Credit Suisse.
[13] Patricia M. Danzon (2018). Differential Pricing of Pharmaceuticals: Theory, Evidence and Emerging Issues. PharmacoEconomics. https://doi.org/10.1007/s40273-018-0696-4.
[14] Patricia Danzon, Adrian Towse, Jorge Mestre-Ferrandiz (2015). Value-Based Differential Pricing: Efficient Prices for Drugs in a Global Context. Health Economics 24: 294–301 (2015).
[15] Lichtenberg, Frank R., Pharmaceutical Price Discrimination and Social Welfare. Capitalism and Society, Vol. 5, Issue 1, Article 2, 2010. Available at SSRN: https://ssrn.com/abstract=2208666.
[16] PMPRB (2020). 2019 Annual Report. Page 46.
[17] PMPRB (2020). 2019 Annual Report. Page 47.
[18] PMPRB (2020). 2019 Annual Report. Page 47.
[19] PMPRB (2020). 2019 Annual Report. Page 45.
[20] PMPRB (2020). 2019 Annual Report. Page 45.
[21] OECD (2021). Purchasing power parities (PPP) (indicator). doi: 10.1787/1290ee5a-en (Accessed on 25 June 2021).
[22] OECD (2021). Gross domestic product (GDP) (indicator). doi: 10.787/dc2faec-en (Accessed on 25 June 2021). 2020 data for Japan not available from OECD; supplemental data obtained from the international monetary fund (IMF).
[23] IMF (2021). IMF DataMapper. https://www.imf.org/external/datamapper/NGDP_RPCH@WEO/OEMDC/ADVEC/WEOWORLD
[24] Danzon, P. M., Wang, R., & Wang, L. (2004). The Impact of Price Regulation on the Launch Delay of New Drugs—Evidence from Twenty-Five Major Markets in the 1990s. Health Economics, 14 (3), 269-292.
[25] Panos Kanavos, Anna‑Maria Fontrier, Jennifer Gill, Olina Efthymiadou (2019). Does external reference pricing deliver what it promises? Evidence on its impact at national level. The European Journal of Health Economics.
[26] Skinner, Brett J. Consequences of over-regulating the prices of new drugs in Canada. Canadian Health Policy, March 27, 2018. https://www.canadianhealthpolicy.com/products/consequences-of-over-regulating-the-prices-of-new-drugs-in-canada.html.
[27] Spicer, Oliver and Paul Grootendorst (2020). An Empirical Examination of the Patented Medicine Prices Review Board Price Control Amendments on Drug Launches in Canada. Working Paper No: 200003. July 2020. Canadian Centre for Health Economics.
[28] Rawson, Nigel SB (2020). Fewer new drug approvals in Canada: early indications of unintended consequences from new patented medicines regulations. Canadian Health Policy, March 2020. https://www.canadianhealthpolicy.com/products/fewer-new-drug-approvals-in-canada–early-indication-of-unintended-consequences-from-new-pmprb-regs-.html
[29] Skinner, Brett J. Patented drug prices and clinical trials in 31 OECD countries 2017: implications for Canada’s PMPRB. Canadian Health Policy, August 2019. https://www.canadianhealthpolicy.com/products/patented-drug-prices-and-clinical-trials-in-31-oecd-countries-2017–implications-for-canada—s-pmprb-.html.
[30] Rawson, Nigel SB (2020). Clinical Trials in Canada Decrease: A Sign of Uncertainty Regarding Changes to the PMPRB? Canadian Health Policy, April 2020. Toronto: Canadian Health Policy Institute. https://www.canadianhealthpolicy.com/products/clinical-trials-in-canada-decrease–a-sign-of-uncertainty-regarding-changes-to-the-pmprb-.html
[31] Rawson, Nigel SB (2021). Clinical Trials in Canada: Worrying Signs that Uncertainty Regarding PMPRB Changes will Impact Research Investment. Canadian Health Policy, February 2021. https://www.canadianhealthpolicy.com/products/clinical-trials-in-canada–worrying-signs-that-pmprb-changes-will-impact-research-investment.html
[32] Rawson, Nigel SB (2021). Clinical Trials in Canada: Worrying Signs Remain Despite PMPRB’s Superficial Response. Canadian Health Policy, March 2021. https://www.canadianhealthpolicy.com/products/clinical-trials-in-canada–worrying-signs-remain-despite-pmprb—s-superficial-response.html
[33] Labrie, Yanick (2020). Evidence that regulating pharmaceutical prices negatively affects R&D and access to new medicines. Canadian Health Policy, June 2020. https://www.canadianhealthpolicy.com/products/evidence-that-regulating-pharmaceutical-prices-negatively-affects-r-d-and-access-to-new-medicines-.html
[34] CHPI (2020). Patented Medicines Expenditure in Canada 1990-2019. Canadian Health Policy, June 2021. https://www.canadianhealthpolicy.com/products/patented-medicines-expenditure-in-canada-1990-2019.html
